Monitoring a Linux host using Grafana, Prometheus and node_exporter
Embarking on the quest for optimal server performance and insightful metrics, I delved into the world of monitoring with Prometheus and Grafana. This blog post encapsulates my experience in setting up a robust monitoring system for my small server running Ubuntu Server 22.04. What makes this journey particularly intriguing is that everything is encapsulated within Docker containers.
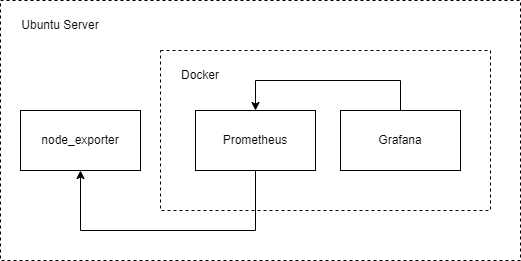
This is how my infrastructure looks like.
Install and run node_exporter
I am collecting metrics from my Linux machine using node_exporter. If you want to collect metrics from Windows, you can follow a similar process using windows_exporter.
wget https://github.com/prometheus/node_exporter/releases/download/v1.7.0/node_exporter-1.7.0.linux-amd64.tar.gz
tar xvfz node_exporter-*.*-amd64.tar.gz
sudo mv node_exporter-*.*-amd64/node_exporter /opt/node_exporter
sudo chmod +x /opt/node_exporter
For testing, use /opt/node_exported. The process is started on port 9100 and you should see some metrics exposed at http://localhost:9100/metrics
Start node_exporter at startup
Most probably, you will want the node_exporter service to be started automatically. You will start by creating the node_exporter.service service using
sudo --preserve-env systemctl edit --force --full node_exporter.service
and it should have the following definition
[Unit]
Description=Node Exporter
Wants=network-online.target
After=network-online.target

[Service]
Type=simple
ExecStart=/opt/node_exporter

[Install]
WantedBy=basic.target
At the end, the service should be enabled with
sudo systemctl daemon-reload
sudo systemctl enable node_exporter.service
sudo systemctl start node_exporter
Install Prometheus and Grafana using Docker
You can fully setup Prometheus and Grafana using my personal DevOPS git repository
git clone https://github.com/StancuFlorin/personal-dev-ops.git
cd personal-dev-ops/monitoring
docker compose up &
The default username and password for Grafana is admin:admin.
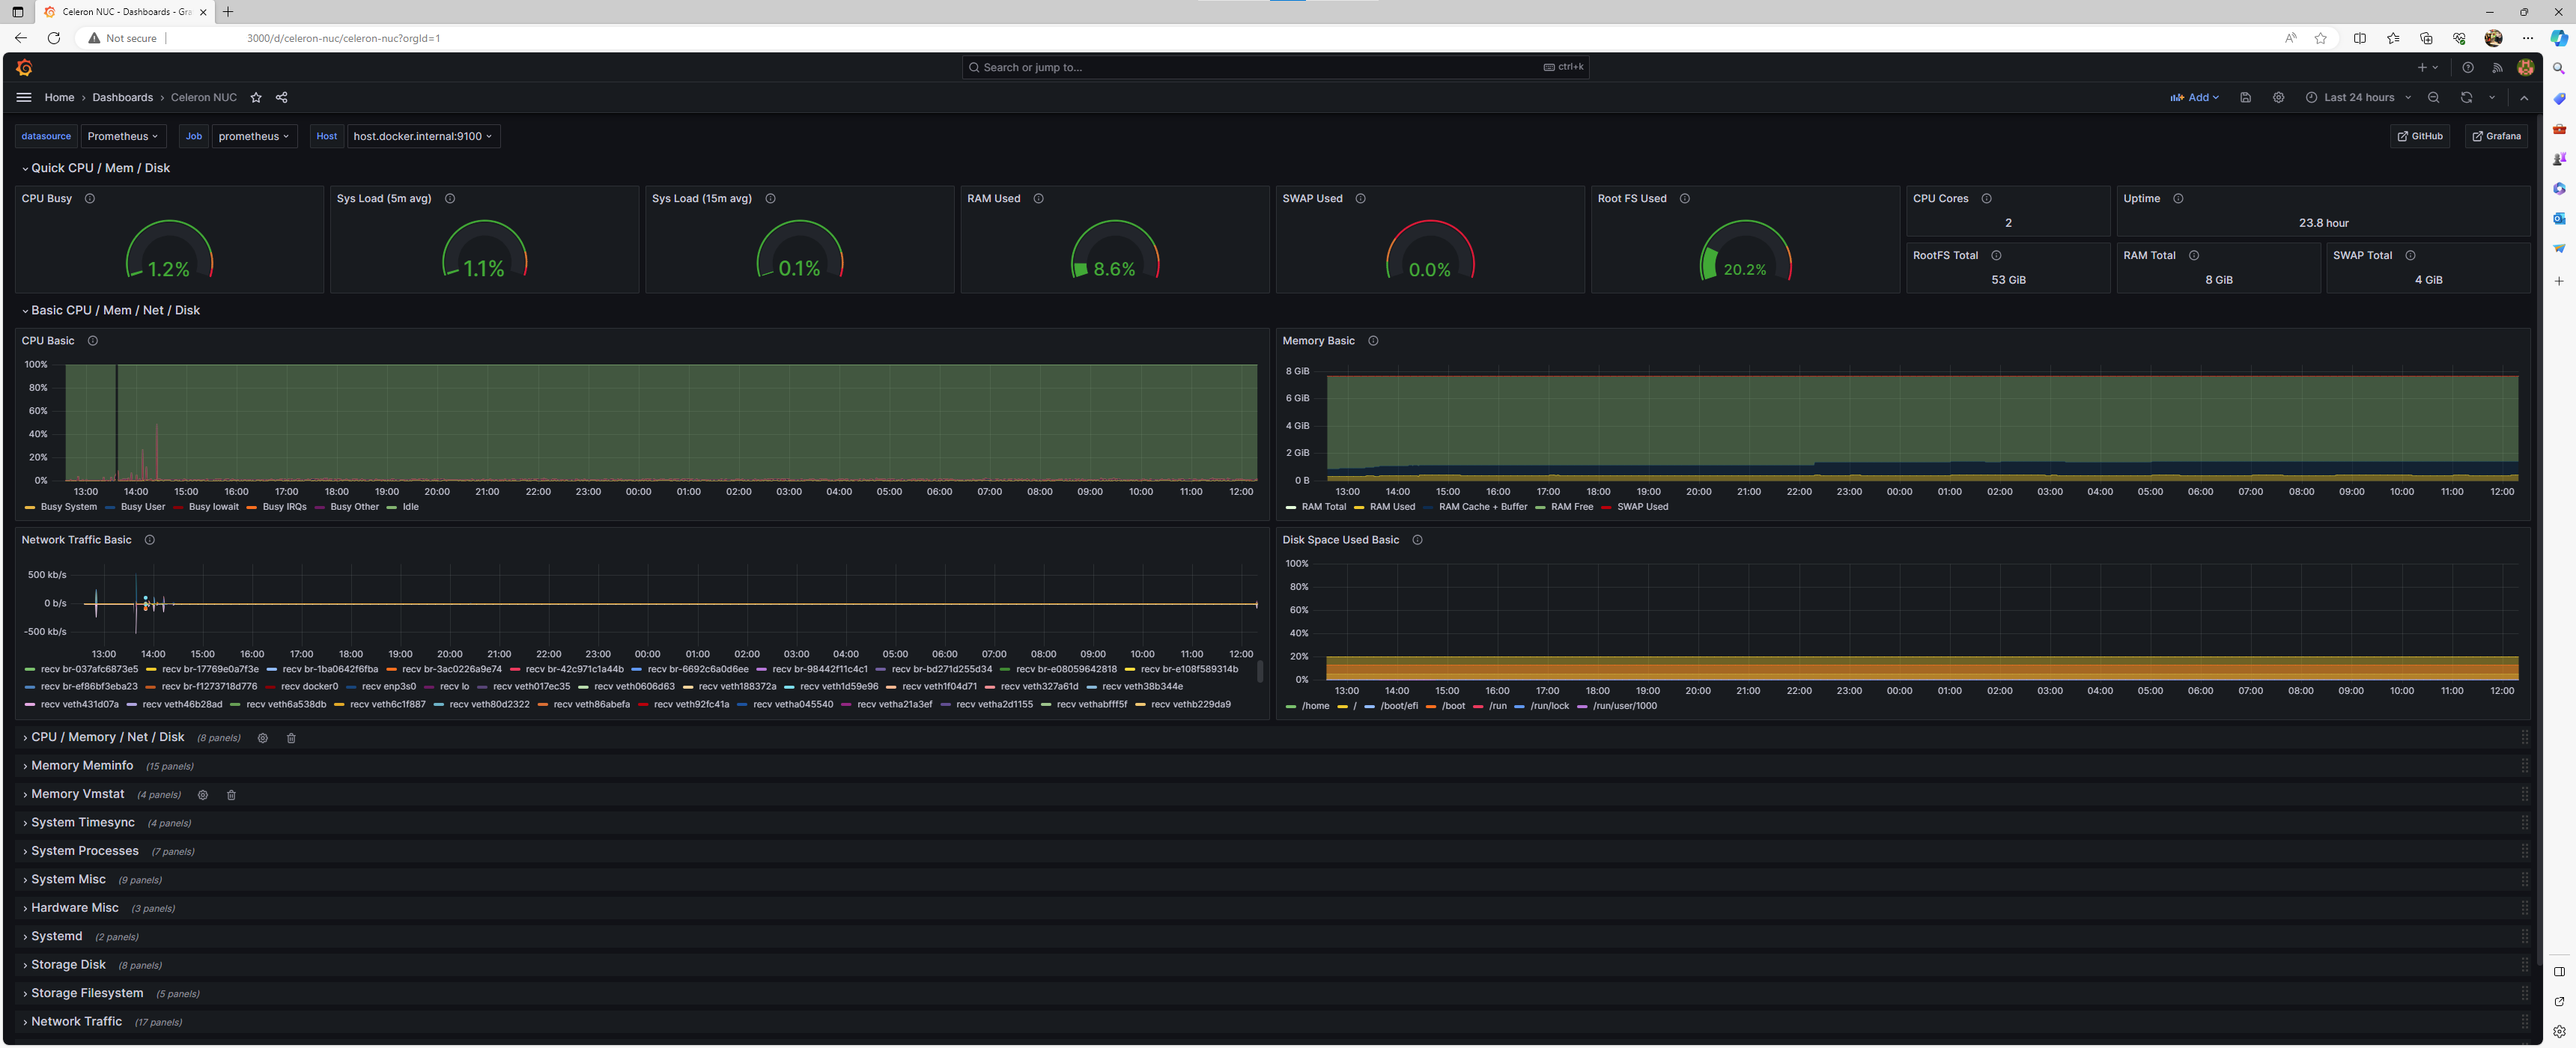
Grafana it is already configured with Prometheus as the default datasource and Node Exporter Full dashboard in installed automatically to showcase linux metrics through Prometheus and node_exporter.